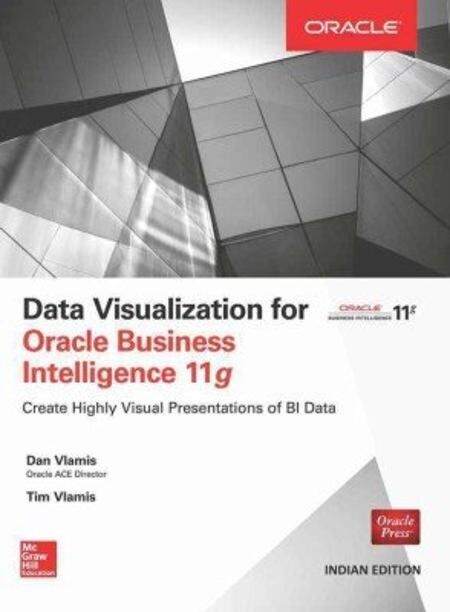
Data Visualization for Oracle Business Intelligence 11g by Dan Vlamis
Cowritten by an Oracle ACE Director and an expert in data visualization design specializing in BI and analytics, Data Visualization for Oracle Business Intelligence 11g reveals best practices for presenting data-driven insights with graphs, tables, maps, dashboards, and other methods that will immediately enhance corporate decision-making. Throughout the book, the principles of effective design are emphasized.
Design and Deliver Effective Visual Solutions of BI Data Co-written by an Oracle ACE Director and an expert in data visualization design specializing in BI and analytics, Data Visualization for Oracle Business Intelligence 11greveals best practices for presenting data-driven insights with graphs, tables, maps, dashboards, and other methods that will immediately enhance corporate decision-making. Throughout the book, the principles of effective design are emphasized. Leverage the power of this comprehensive business intelligence platform to deliver rich visualizations of business information across the enterprise.
Features
- Create well-organized tables and pivot tables
- Convey data insights with line, bar, pie, waterfall, radar, and other graphs
- Configure MapViews so that you can provide interactive maps and spatial analysis capabilities
- Build advanced visualizations, including trellis charts, gauges, R images, jQuery sparklines, and more
- Use Oracle Business Intelligence Publisher to create pixel-perfect reports from various data sources
- Design effective, interactive BI dashboards
- Use the Oracle Scorecard and Strategy Management module to measure, evaluate, and manage key performance indicators
- Make smart color choices using data science tools
| Product Name | Data Visualization for Oracle Business Intelligence 11g by Dan Vlamis |
|---|---|
| ISBN / Product Code | 9789339222406 |
| Author | Dan Vlamis and Tim Vlamis |
| Entrance & College Books | Text Books |
| Binding | Paperback |
| Publisher | Tata Mcgraw Hill |
| Subject : College Books | Computer |
| HSN Code | 4901 |


